The Supply Question
New Hanover County's condo market has shifted significantly since 2020. Transaction volume has been cut nearly in half, days on market have climbed from 7 days in 2021 to 47, and the county is sitting on 7.0 months of active inventory countywide. On the surface, that might look like a market that's cooling and doesn't need more product.
But the headline numbers don't tell the whole story. When you break the county into its three distinct submarkets (Wrightsville Beach, the Pleasure Island beaches, and mainland Wilmington) and then segment by price tier, the data tells a different story. Some segments are genuinely oversupplied. Others are showing clear signals of unmet demand.
I pulled every condo transaction in New Hanover County from 2020 through early 2026, a total of 4,607 records from the NCRMLS, and cross-referenced it against 1,210 new construction sales from 2024 to 2025 to find out where the opportunities are.
The Countywide Picture: 2020 to 2025
Here are the annual trend lines for every condo sale in New Hanover County:
| Year | Sales | Med. Price | Med. $/SF | Med. DOM | List/Sold | Cash % |
|---|---|---|---|---|---|---|
| 2020 | 943 | $235,000 | $242 | 16 | 98.1% | 34.0% |
| 2021 | 1,032 | $263,000 | $273 | 7 | 100.0% | 34.0% |
| 2022 | 718 | $316,500 | $328 | 7 | 100.0% | 41.5% |
| 2023 | 558 | $355,000 | $373 | 14 | 98.6% | 38.5% |
| 2024 | 537 | $347,500 | $346 | 37 | 97.7% | 38.4% |
| 2025 | 490 | $363,000 | $374 | 47 | 97.2% | 42.7% |
Source: NCRMLS, 2020-2025 closed condo sales. n = 4,278 full-year transactions.
Three phases stand out: a pandemic-era surge (2020 to 2021), a rate-shock correction (2022 to 2023), and a slow normalization (2024 to 2025). Volume has dropped 52.5% from the 2021 peak, but prices have held. Median sold price is up 54.5% from 2020 ($235K to $363K), and price per square foot has risen at the same rate ($242 to $374).
The market isn't falling apart. It's repricing time, moving from seven-day-on-market pace to a more normal 47-day median. The list-to-sold ratio has come down from 100% to 97.2%, which still reflects healthy pricing discipline. And the cash buyer share has actually climbed to 42.7% in 2025, suggesting the buyer pool skews toward well-capitalized purchasers who are less rate-sensitive.
Three Markets in One County
The countywide numbers are misleading on their own. New Hanover County's condo market is really three distinct markets operating on different fundamentals.
Wrightsville Beach: Trophy Market, Limited Supply
| Year | Sales | Med. Price | Med. $/SF | Med. DOM | List/Sold | Cash % |
|---|---|---|---|---|---|---|
| 2020 | 95 | $800,000 | $600 | 46 | 96.1% | 42% |
| 2021 | 109 | $900,000 | $685 | 7 | 99.4% | 45% |
| 2022 | 62 | $1,030,000 | $875 | 17 | 100.0% | 66% |
| 2023 | 51 | $1,275,000 | $929 | 20 | 96.2% | 49% |
| 2024 | 43 | $1,250,000 | $1,022 | 17 | 98.7% | 53% |
| 2025 | 34 | $1,480,000 | $1,058 | 26 | 97.5% | 74% |
Source: NCRMLS. Filtered: City = Wrightsville Beach.
Wrightsville Beach operates on its own set of rules. The median condo here sold for $1.48 million in 2025, and nearly three out of four buyers paid cash. Volume is low (34 sales) because there simply isn't much inventory, just 27 active listings as of February 2026, representing 8.4 months of supply.
Over 80% of the traded stock was built before 2000. The price per square foot has breached $1,000 and has continued to climb. This is a trophy market where demand is real but constrained by geography and zoning rather than buyer appetite.
Carolina Beach and Kure Beach: The Softening Middle
| Year | Sales | Med. Price | Med. $/SF | Med. DOM | List/Sold | Cash % |
|---|---|---|---|---|---|---|
| 2020 | 317 | $295,000 | $317 | 21 | 97.3% | 25% |
| 2021 | 353 | $390,000 | $389 | 6 | 100.0% | 21% |
| 2022 | 256 | $440,000 | $488 | 8 | 100.0% | 29% |
| 2023 | 196 | $452,500 | $518 | 32 | 97.9% | 30% |
| 2024 | 168 | $504,500 | $509 | 58 | 96.8% | 29% |
| 2025 | 187 | $505,000 | $506 | 51 | 96.5% | 33% |
Source: NCRMLS. Filtered: City in (Carolina Beach, Kure Beach).
Pleasure Island is where the data starts telling a softer picture. The median price plateaued around $505,000 in 2024 to 2025 after a rapid run-up from $295,000 in 2020. Velocity has slowed considerably: median DOM stretched to 51 to 58 days, and only about a third of buyers are paying cash.
With 145 active listings and an absorption rate of roughly 14.8 units per month, the beaches are carrying 9.8 months of supply, well into buyer's market territory. This submarket does not need new supply at current price points.
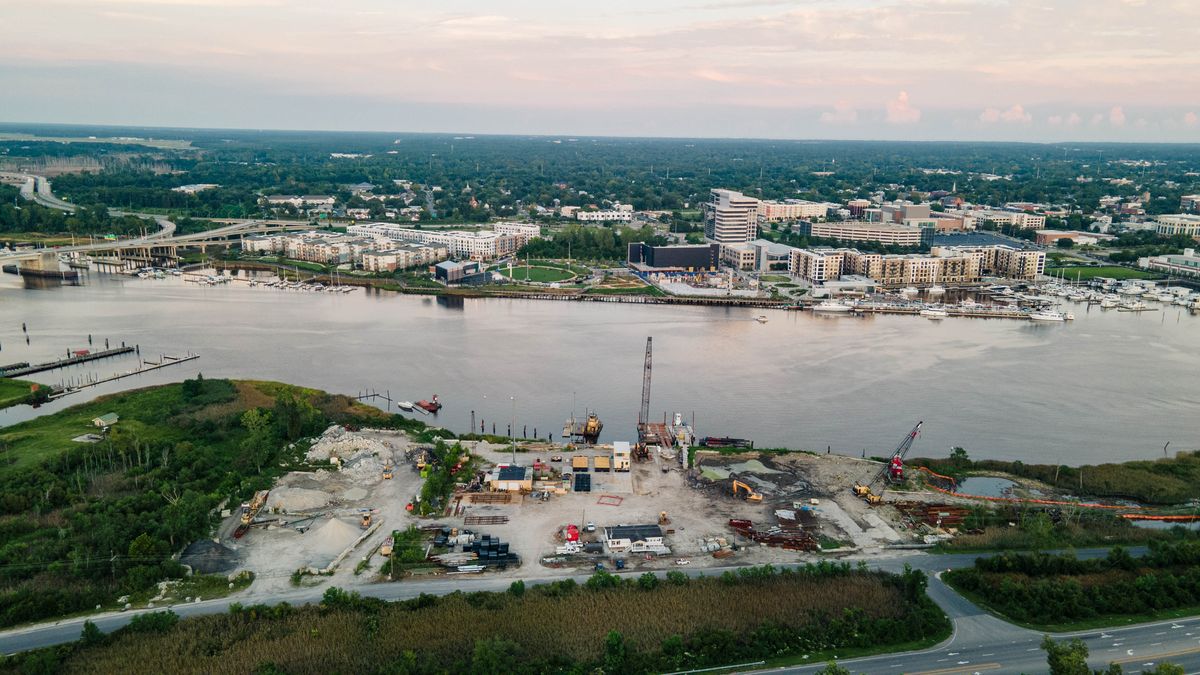
Wilmington: Where the Demand Signal Is Clearest
| Year | Sales | Med. Price | Med. $/SF | Med. DOM | List/Sold | Cash % |
|---|---|---|---|---|---|---|
| 2020 | 531 | $155,000 | $138 | 12 | 98.7% | 38% |
| 2021 | 570 | $180,000 | $157 | 7 | 100.0% | 40% |
| 2022 | 400 | $225,000 | $192 | 6 | 100.0% | 46% |
| 2023 | 311 | $248,000 | $210 | 8 | 100.0% | 42% |
| 2024 | 326 | $244,250 | $215 | 29 | 98.6% | 41% |
| 2025 | 269 | $245,000 | $213 | 46 | 97.1% | 46% |
Source: NCRMLS. Filtered: City = Wilmington.
Mainland Wilmington is the volume engine of the county's condo market, accounting for 55% of all sales in 2025. The supply picture here looks different from the beaches: just 5.1 months of supply, the only submarket below the six-month balanced threshold.
Demand is concentrated in the $200K to $300K range, which captured 45.9% of all Wilmington condo sales in 2024 to 2025 (273 of 595 transactions). Add in the under-$200K tier, and 68% of Wilmington condo demand falls below $300,000.
And here's the critical point: there is virtually no new condo construction happening in Wilmington. Zero new-construction condo sales were recorded in 2024 to 2025 on the mainland. The market is absorbing aging inventory because there is nothing else to buy.
Where Is the Demand? A Price-Tier Breakdown
To answer the supply question precisely, we need to look at demand by price point:
| Price Tier | 2023 | 2024 | 2025 | Active | Mo. Abs. | Mos. Supply | Signal |
|---|---|---|---|---|---|---|---|
| Under $200K | 60 | 68 | 64 | 22 | 5.5 | 4.0 | Strong |
| $200K-$300K | 172 | 154 | 128 | 64 | 11.8 | 5.4 | Strong |
| $300K-$400K | 99 | 92 | 81 | 58 | 7.2 | 8.0 | Soft |
| $400K-$500K | 76 | 63 | 62 | 41 | 5.2 | 7.9 | Soft |
| $500K-$750K | 96 | 95 | 97 | 61 | 8.0 | 7.6 | Balanced |
| $750K-$1M | 18 | 32 | 21 | 29 | 2.2 | 13.1 | Oversupplied |
| $1M+ | 37 | 33 | 37 | 24 | 2.9 | 8.2 | Soft |
Source: NCRMLS. Monthly absorption = avg of 2024 + 2025 volume ÷ 12. Months of supply = active listings ÷ monthly absorption.
The two price tiers below $300,000 are the only segments with months of supply under six. The under-$200K tier has just 4.0 months of supply, and the $200K to $300K tier sits at 5.4 months. These are the price points where buyers are active and inventory is turning.
The $750K to $1M segment is carrying over 13 months of supply. The $300K to $500K range hovers around 8 months. And the $500K to $750K band is roughly balanced, driven almost entirely by beach product.
What Builders Are Actually Building
If condo demand is strongest below $300,000, the next question is obvious: what's being delivered at that price point? To answer that, I pulled every new construction sale in New Hanover County from 2024 to 2025, a total of 1,210 transactions.
The New Construction Mix
| Product Type | Sales | Share | Median Price | Median $/SF | Price Range |
|---|---|---|---|---|---|
| Single Family | 921 | 76.1% | $579,900 | $257 | $250K-$4.2M |
| Townhouse | 281 | 23.2% | $545,707 | $244 | $309K-$2.4M |
| Condominium | 5 | 0.4% | $1,650,000 | $1,125 | $395K-$4.1M |
| Manufactured | 3 | 0.2% | $299,900 | $205 | $280K-$350K |
Source: NCRMLS, 2024-2025 new construction closed sales. n = 1,210.
Builders delivered 921 single-family homes and 281 townhouses in 2024 to 2025, but just five condominiums, and all five were luxury product (median $1.65 million). Three sold on Wrightsville Beach above $1.6 million, one was a $1.6 million unit at North Pier on Carolina Beach, and the only new condo below $500,000 was a $395,000 unit at Paradise Cove on Carolina Beach.
In other words: builders are actively constructing attached product in New Hanover County. They're just building townhouses instead of condos, and they're pricing them well above the condo demand sweet spot.
The Pricing Gap
Here is where the disconnect becomes clearest. When you map new construction sales against the price tiers where condo demand is strongest:
| Price Tier | NC Total | NC SFR | NC TH | NC Condo | Existing Condo Sales (2024-25) |
|---|---|---|---|---|---|
| Under $200K | 0 | 0 | 0 | 0 | 132 |
| $200K-$300K | 8 | 6 | 0 | 0 | 282 |
| $300K-$400K | 211 | 155 | 54 | 1 | 173 |
| $400K-$500K | 255 | 200 | 55 | 0 | 125 |
| $500K-$750K | 459 | 344 | 115 | 0 | 192 |
| $750K-$1M | 156 | 117 | 39 | 0 | 53 |
| $1M+ | 121 | 99 | 18 | 4 | 70 |
Source: NCRMLS, new construction and condo datasets cross-referenced. NC = new construction. Existing condo sales cover 2024-2025.
Below $300,000, where condo demand is most concentrated, builders delivered just 8 new homes total and zero condos. Meanwhile, 414 existing condo sales closed in that same price band during 2024 to 2025, almost all of it aging 1980s to 2000s product with a median year built of 1998. There are 455 existing condo sales when you include the broader $200K to $400K range, and the buyers in that range have essentially no modern alternative.
The townhouse market is instructive. Builders delivered 281 townhouses with a median price of $545,707, proof that the market supports new attached product. The most active townhouse communities (Springwater Reserve at $416K median, Jasmine South at $395K, Preservation Point at $410K) are operating in and around the upper end of the condo demand zone, and they're absorbing well.
The Only New Condo Project in the Pipeline
One project stands out in the data: Midpark in Wilmington. It has seven presale listings currently active in the MLS, ranging from $350,000 to $525,000 with units between 895 and 1,450 square feet. With a projected completion year of 2027, it's the only new condo development of any scale currently in the pipeline on the mainland.
Midpark's pricing is worth watching. At $350K to $525K, it sits above the core demand pocket ($200K to $300K) but below the softening $750K+ range. Whether it proves the market for new condo product or gets stuck in the gap between resale pricing and new construction costs will be an important signal for future development.
The Aging Stock Problem
Across the county, 55.1% of condos sold in 2024 to 2025 were built between 1980 and 1999. Another 29.6% date to 2000 to 2009. Only 4.4% were built in 2020 or later. In Wilmington specifically, the top-selling condo communities in the $200K to $400K range tell the story:
| Community | Sales | Median Price | Median Year Built |
|---|---|---|---|
| Breezewood Condominiums | 33 | $257,500 | 1998 |
| Rivers Edge | 24 | $274,250 | 2005 |
| Cape Cottages | 24 | $219,750 | 1997 |
| River Place | 20 | $322,688 | 2020 |
| Willoughby Park | 19 | $238,000 | 1999 |
| Tara Court | 14 | $240,000 | 1987 |
| The Gardens | 13 | $234,000 | 2007 |
| Park Place | 12 | $214,000 | 1984 |
Source: NCRMLS. Filtered: City = Wilmington, Sold Price $200K-$400K, Sold Date 2024-2025. Top 8 communities by sales volume.
Six of the top eight communities were built before 2000. These are the buildings absorbing demand right now, not because buyers prefer 30-year-old product, but because it's what's available. River Place (built 2020, median $323K) is the lone modern comp, and its 20 sales in two years suggest buyers will choose newer product when it's available.
So, Is NHC Ready for More Condos?
The short answer: yes, but only at the right price and in the right submarket.
The data supports new condo development in mainland Wilmington, targeted at the $200K to $350K price range, where months of supply is below 6.0, nearly 70% of buyer demand is concentrated, and builders are currently delivering zero new condo units.
Where the opportunity is:
- Wilmington mainland, $200K to $300K: 5.4 months of supply, 11.8 units absorbed per month, 45.9% of all Wilmington condo sales. Zero new construction competing at this price point.
- Wilmington mainland, under $200K: 4.0 months of supply. Tight, but may be difficult for new construction to hit this price point.
- Wilmington mainland, $300K to $400K: 8.0 months of supply countywide, but Wilmington-specific demand (88 sales in 2024 to 2025) and the success of townhouses at similar pricing suggest a modern condo could compete against aging resale stock.
Where to be cautious:
- Carolina Beach / Kure Beach: 9.8 months of supply, slowing velocity, and 145 active listings to clear. New supply here would compete with an existing backlog.
- The $750K to $1M tier anywhere: 13.1 months of supply. This segment is clearly oversupplied.
- Wrightsville Beach: Demand exists but is constrained by land availability and zoning. The question isn't market demand, it's entitlement feasibility.
What to watch:
- Midpark in Wilmington: Seven presale units at $350K to $525K. Absorption pace will be a leading indicator of appetite for new condo product on the mainland.
- Townhouse absorption: 281 new townhouse sales prove demand for attached product. Communities like Jasmine South ($395K) and Preservation Point ($410K) are operating near the upper condo demand zone.
Key Takeaways
- Volume has normalized, not collapsed. 490 condo sales in 2025 against a 2021 peak of 1,032. The surge is over, but the market is still functioning.
- Prices have held. Median sold price is up 54.5% since 2020 despite the volume decline. Sellers are not capitulating.
- Wilmington is the demand center. 5.1 months of supply, 55% of county sales, and a clear concentration of demand in the $200K to $300K range.
- Builders are not building condos. Of 1,210 new construction sales in 2024 to 2025, just 5 were condos (0.4%), all luxury. Zero new condos sold in Wilmington. The market is entirely dependent on aging resale inventory.
- The condo buyer pool is buying 30-year-old buildings. 55.1% of sold condos were built 1980 to 1999 because no modern alternative exists below $500K.
- The beaches are a different story. 9.8 months of supply on Pleasure Island and a luxury-only market on Wrightsville Beach. Neither signals a need for more inventory.
- The sweet spot is $200K to $350K in Wilmington. This is where demand, supply constraints, and the total absence of new product all converge.
Data Sources and Methodology
Data Source: NCRMLS (North Carolina Regional MLS)
Condo Sales Data: 4,607 records: April 2020 through February 2026. Full-year analysis uses 2020-2025 (4,278 transactions).
New Construction Data: 1,210 closed sales: January 2024 through December 2025. All residential product types in New Hanover County.
Geography: New Hanover County, NC: Wilmington, Wrightsville Beach, Carolina Beach, Kure Beach
Submarket Definitions: Wrightsville Beach = City 'Wrightsville Beach' | Carolina/Kure Beach = City in ('Carolina Beach', 'Kure Beach') | Wilmington = City 'Wilmington'
Absorption Calculation: Average of 2024 and 2025 annual sales ÷ 12 = monthly absorption rate
Months of Supply: Active inventory ÷ monthly absorption rate
Price Metrics: Median values used throughout to minimize impact of outliers
Analysis Date: February 2026
Note: MLS data represents properties marketed through the Multiple Listing Service and may not capture all builder-direct or off-market transactions. Days on Market is calculated from MLS marketing start date to contract date. Active inventory counts reflect a single snapshot in time (February 2026) and fluctuate daily.